AMX500 – The Amazon Marketindex

How do you perform compared to other Amazon advertisers?

Gain insight into the performance of 500 Amazon advertisers.

Identify trends over time

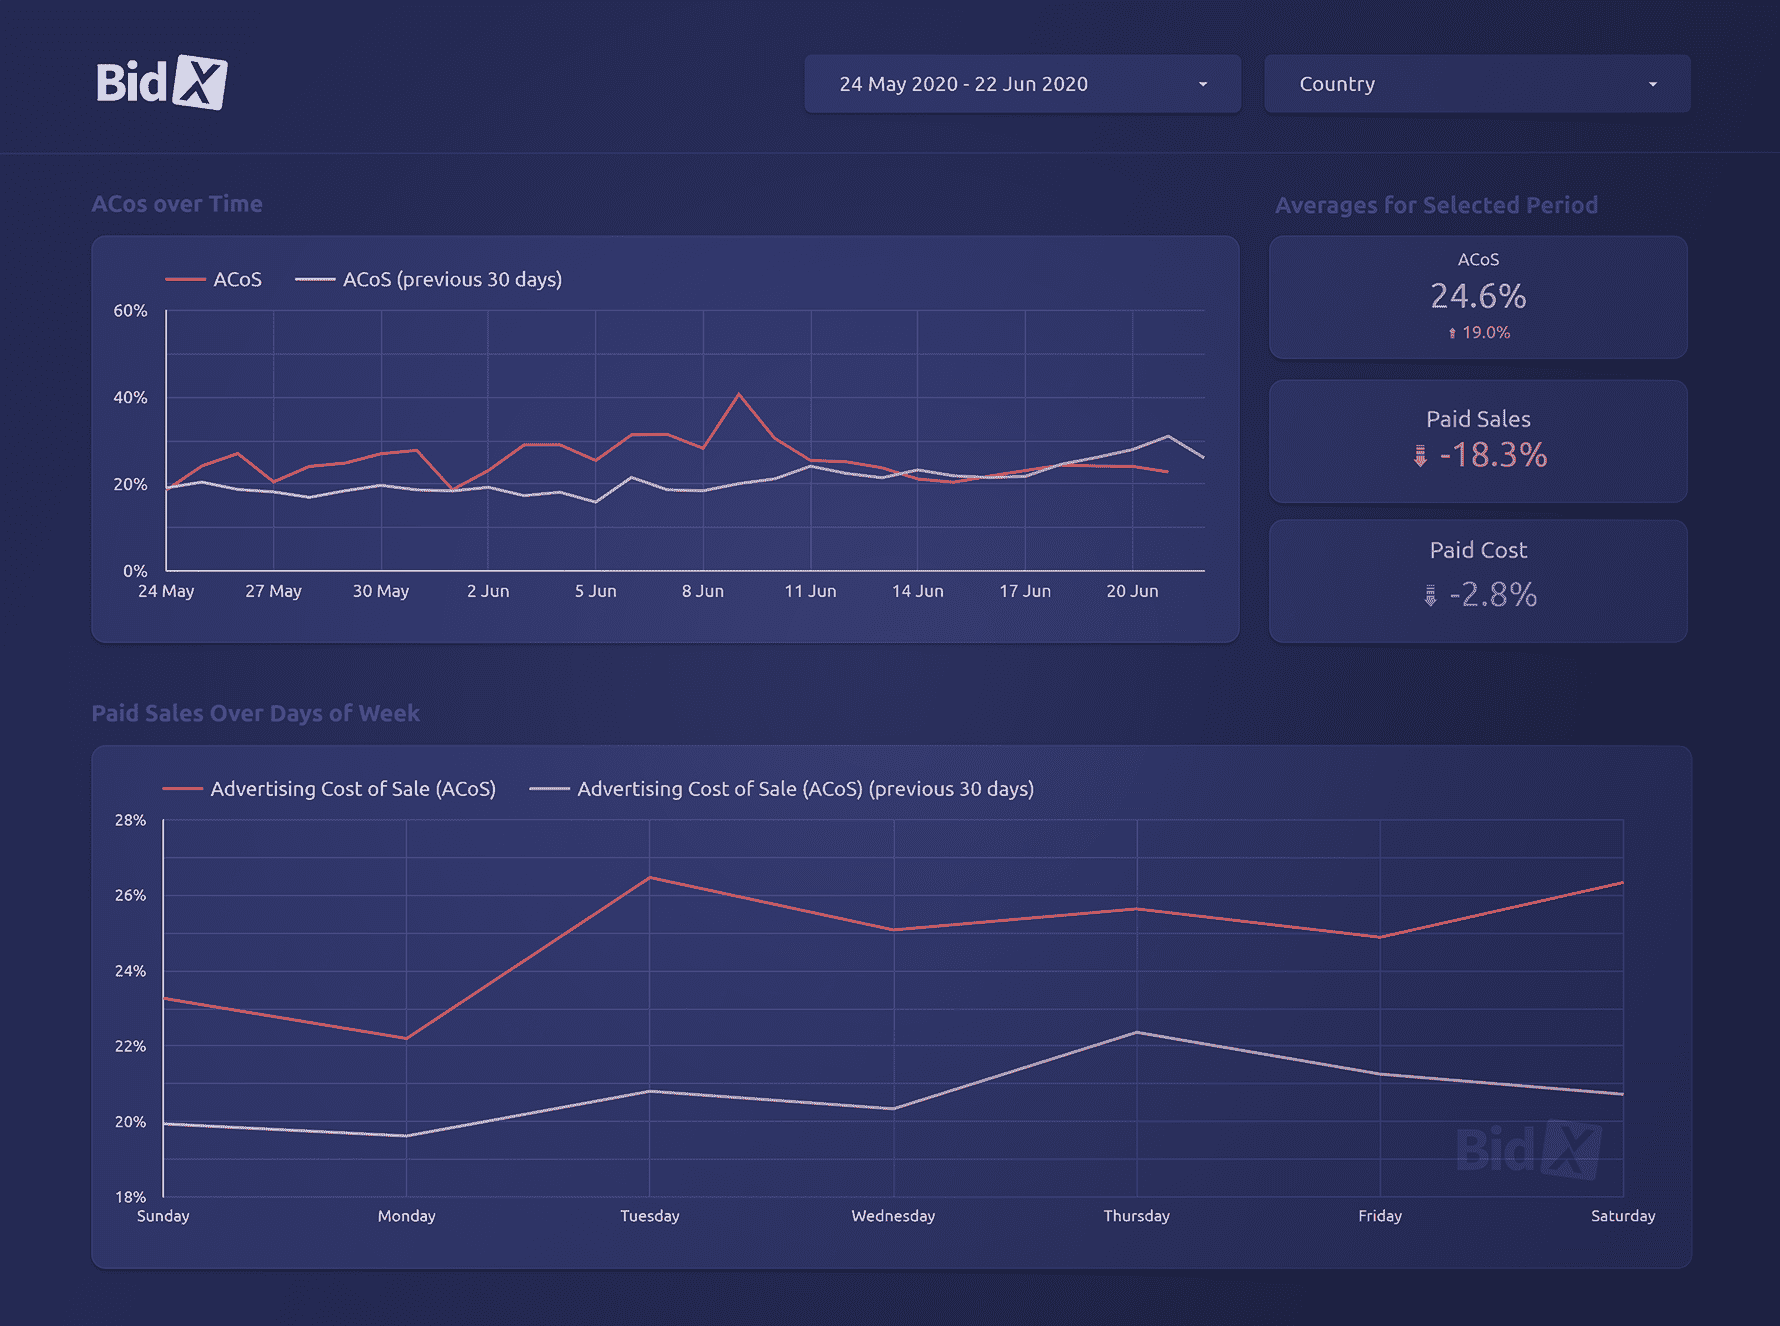
With AMX500, data from other merchants are made transparent. You can display the average advertising performance values of 500 Amazon merchants during the period of your choice.

Compare key figures with your own data

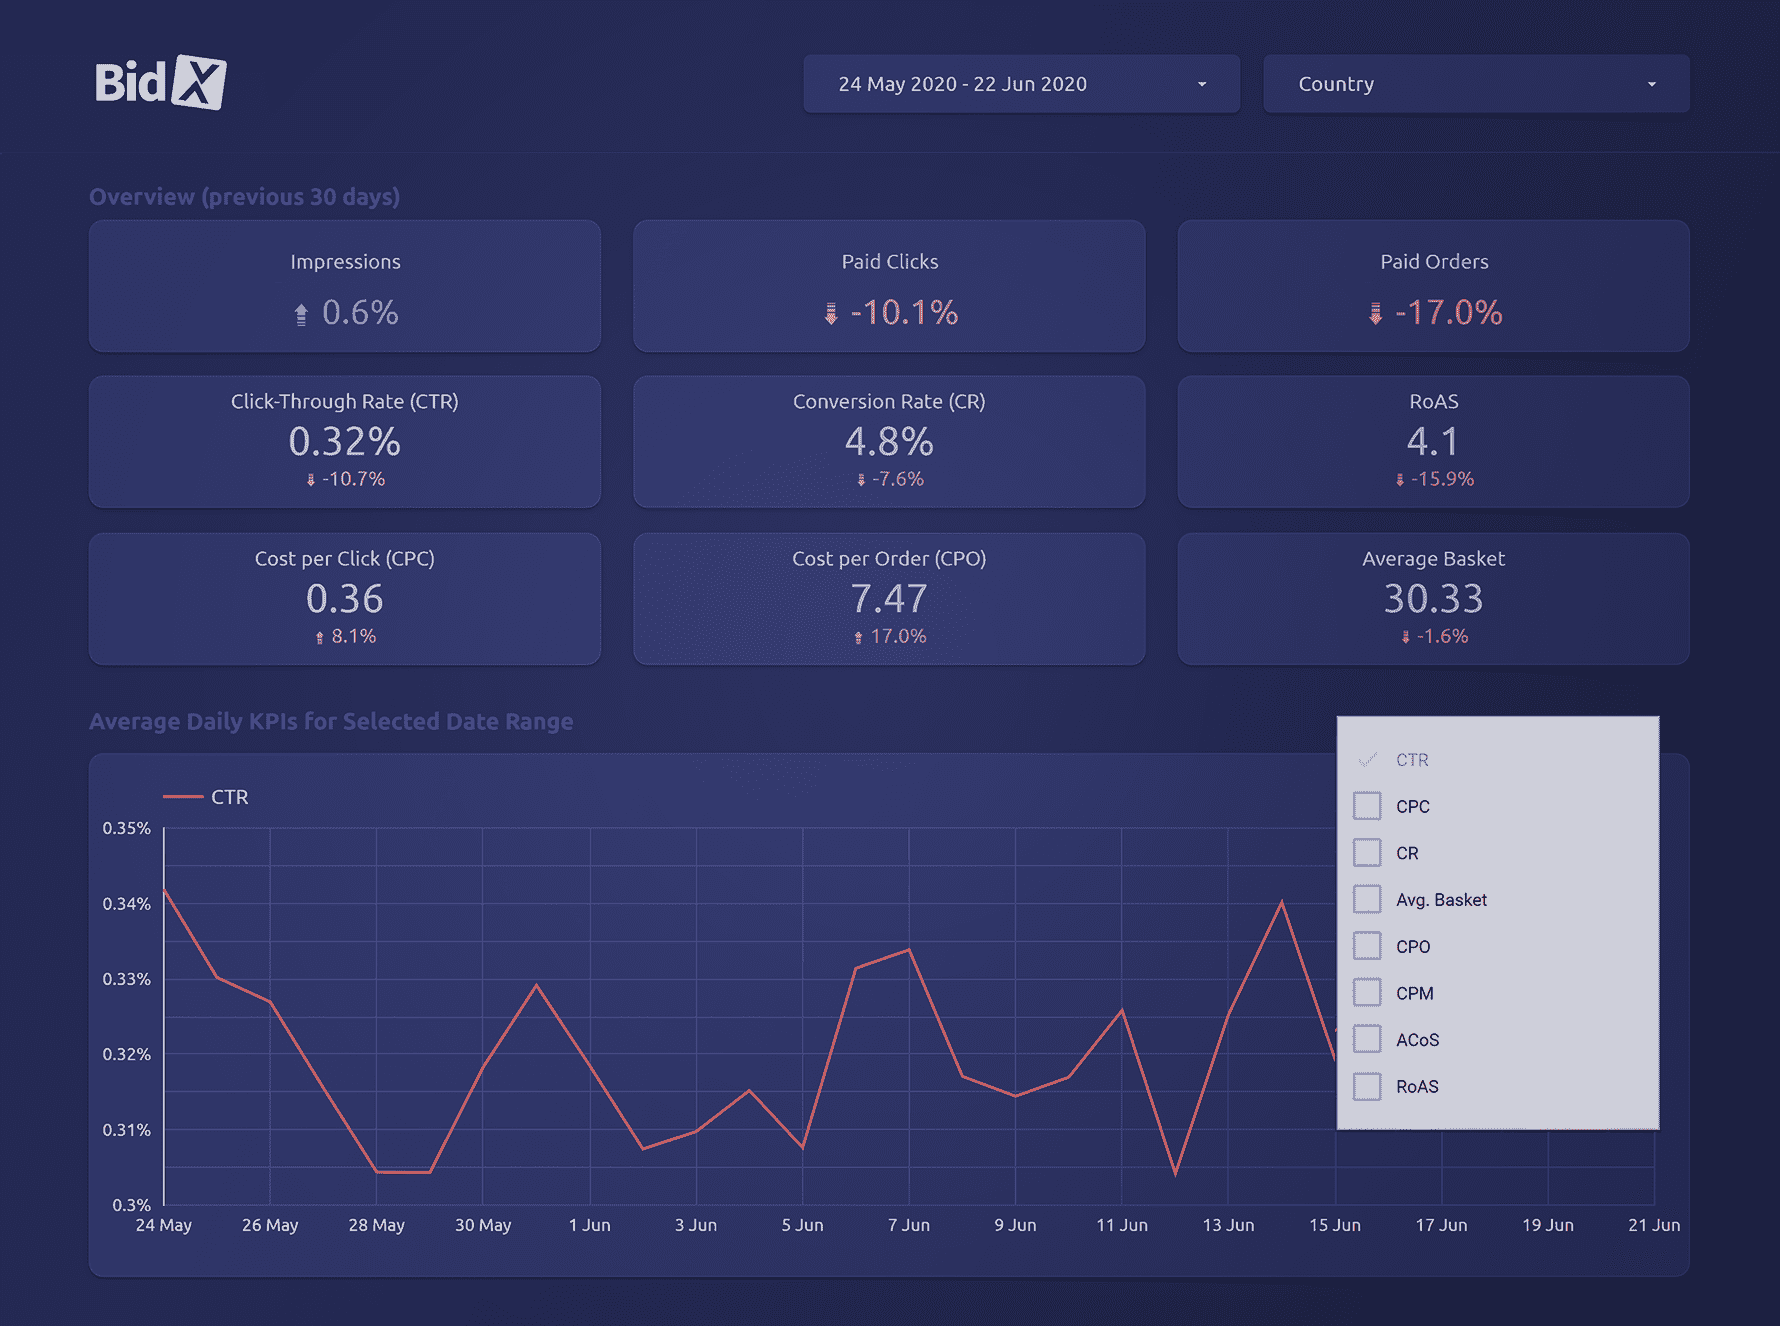
Interested in the average ACOS, Click-Through Rate, Conversion Rate, ... of other merchants? AMX500 provides the insights you are looking for. See at a glance whether your own data is above or below average.

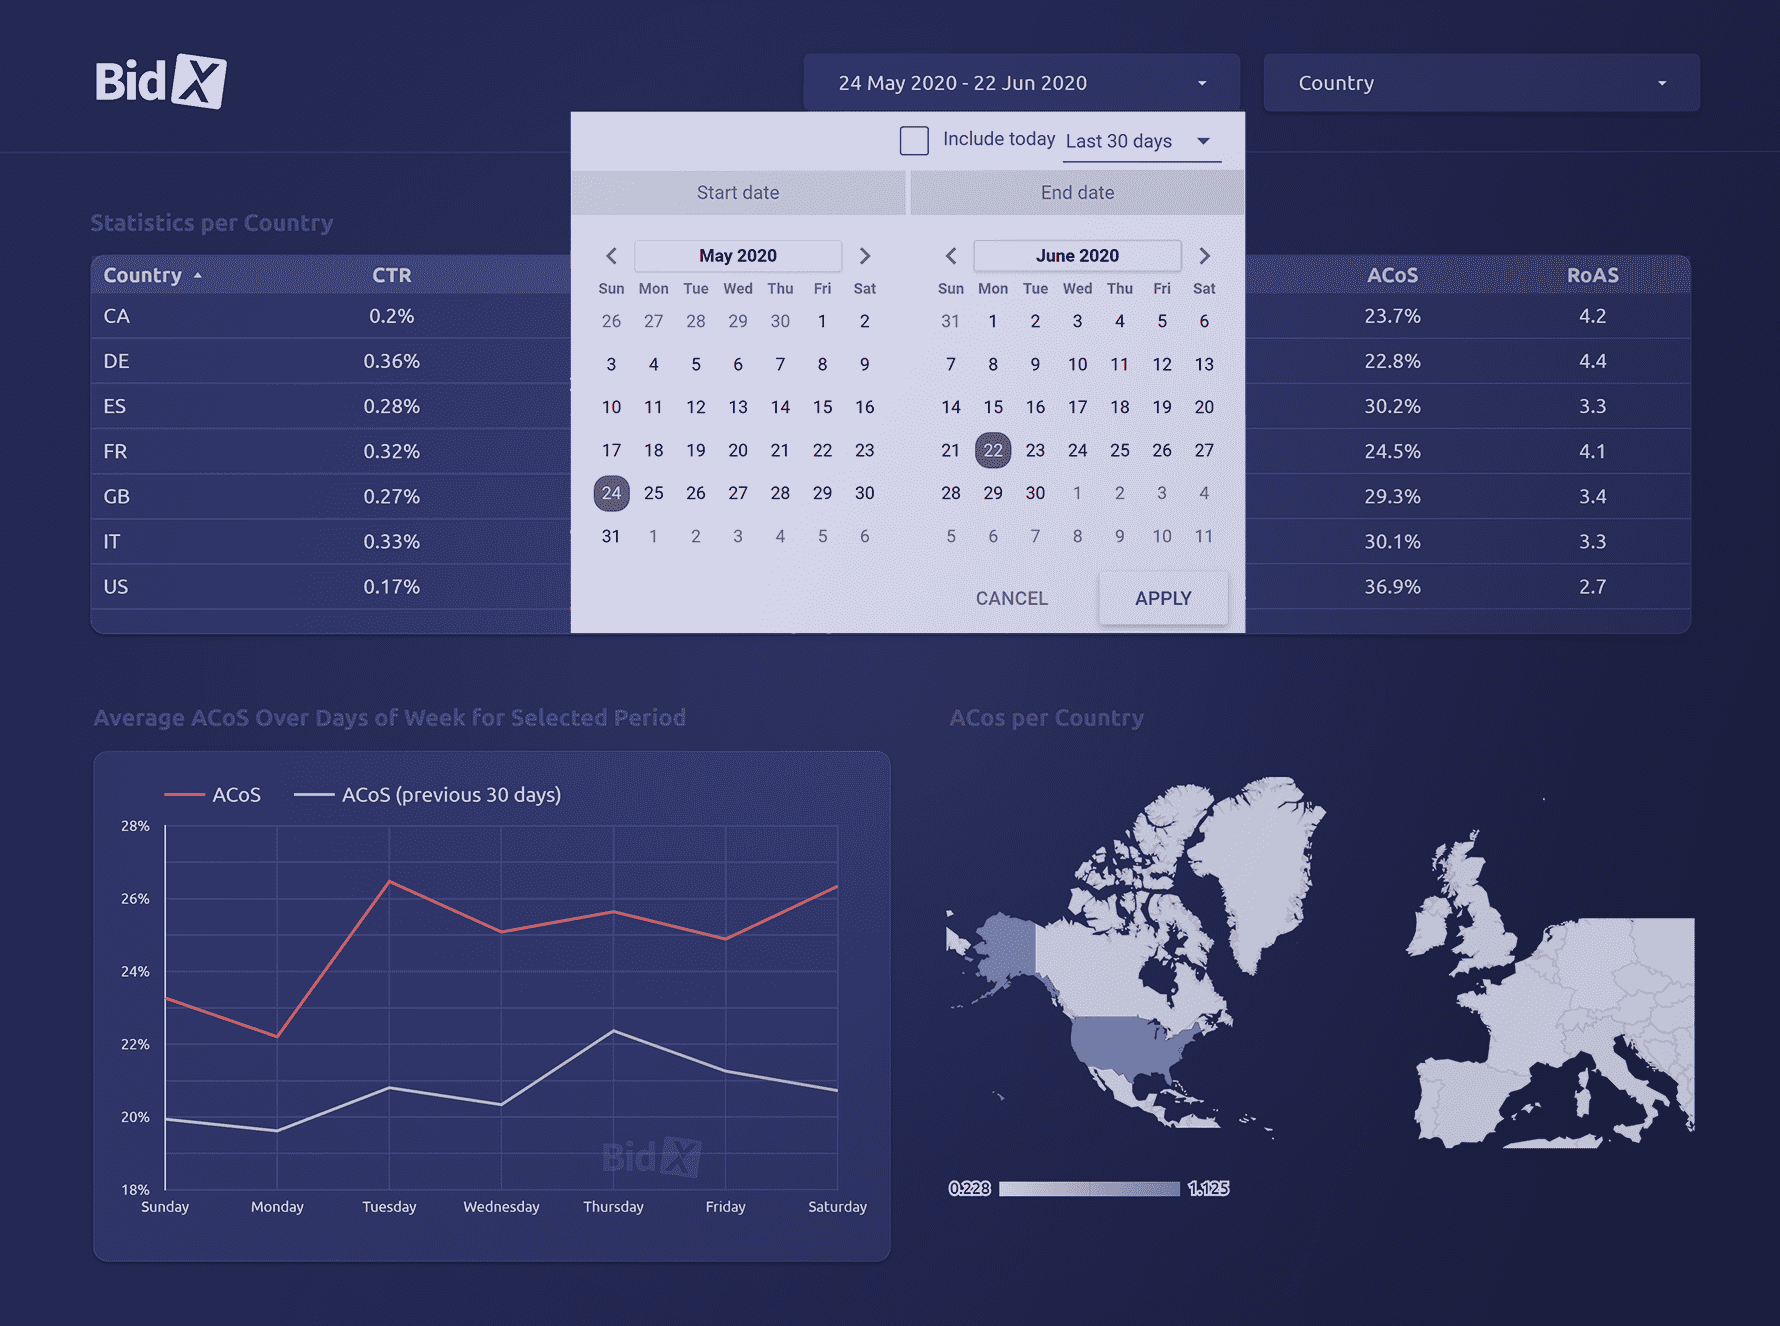
Filter by time period or country

Whether you want to see differences between countries or display conspicuous variations in monthly and weekday comparisons: Use the filter option to identify trends over time and the markets that can offer the best opportunities for your advertisements.
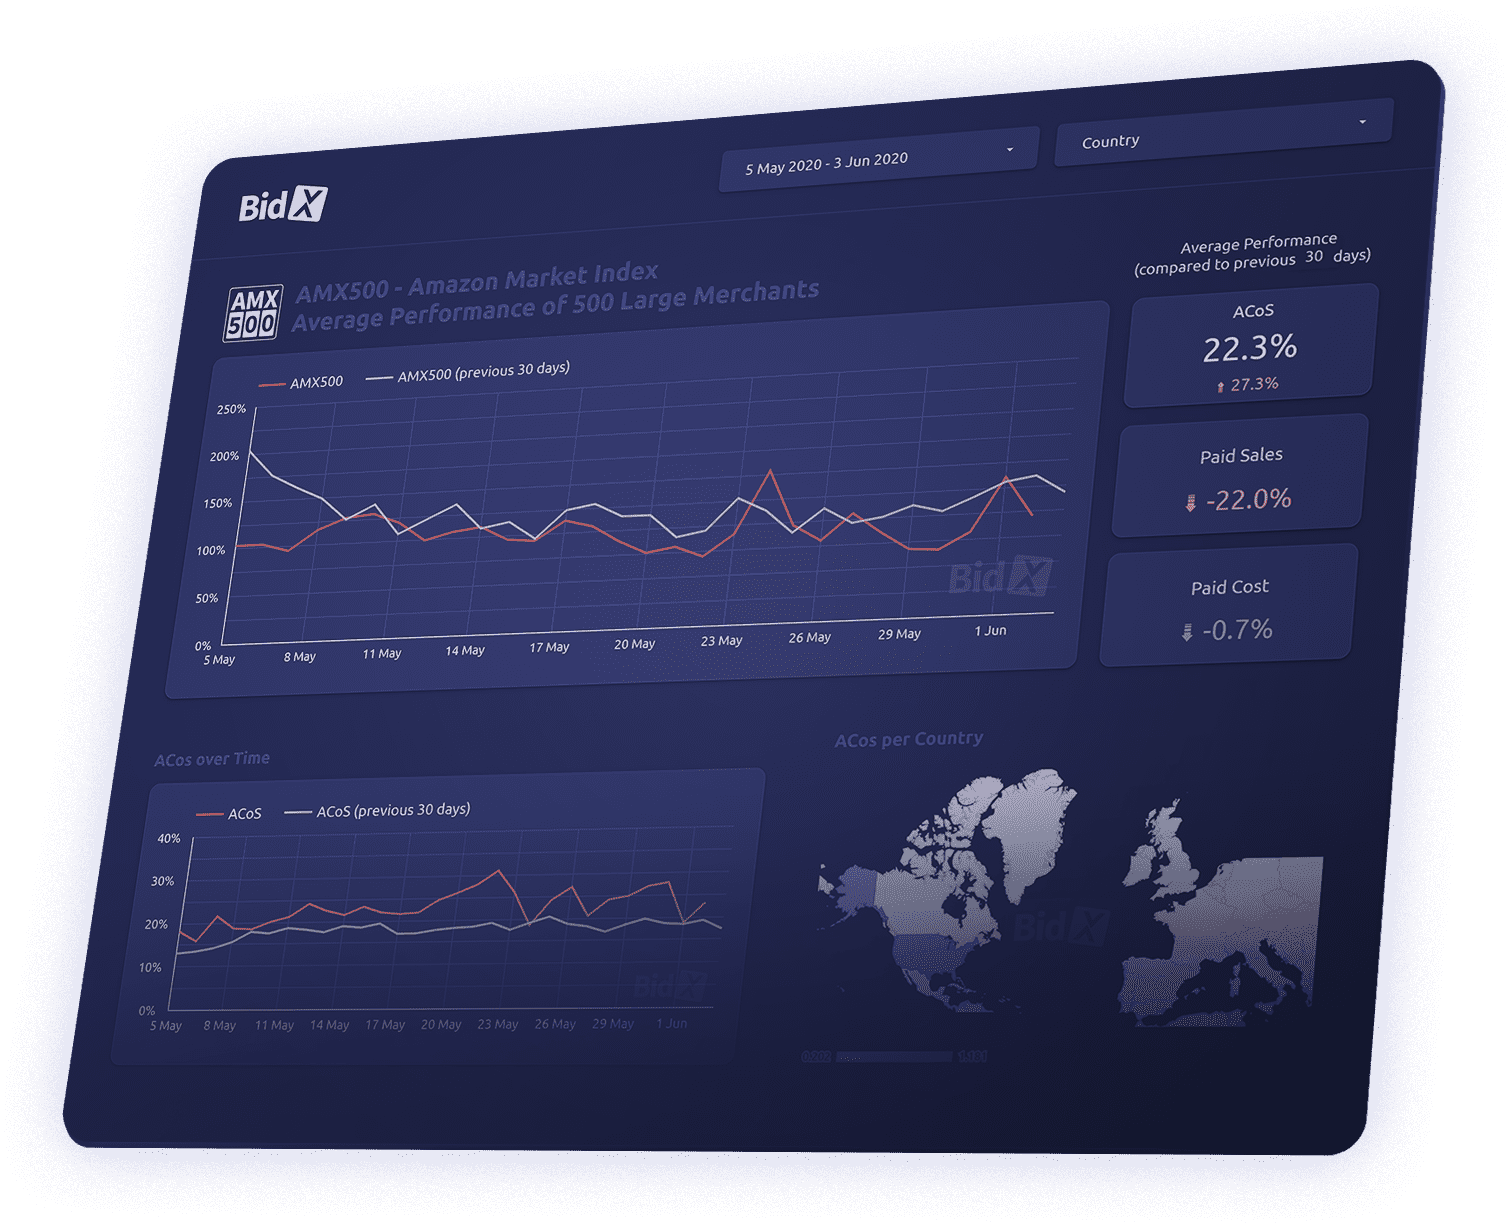
Highlights at a glance.

Interactive dashboard

See the most important advertising data from 500 international Amazon merchants, visualized in clear graphics and accessible all in one place.

Optimal data usage

Identify trends and use this data to make well-founded business decisions for future action.

Transparent key figures

Capture and analyze important key figures such as ACOS and Conversion Rate at a glance.

Free access

Access to AMX500 is free of charge and is sent exclusively via an invitation link.

Profitable insights

By analyzing data over time, identify relevant trends for your business and incorporate them into your own decision-making process.

Easy download

Export your required reports as CSV or PDF with ease and share them with colleagues.

Get answers

With AMX500 you can answer these and similar questions:

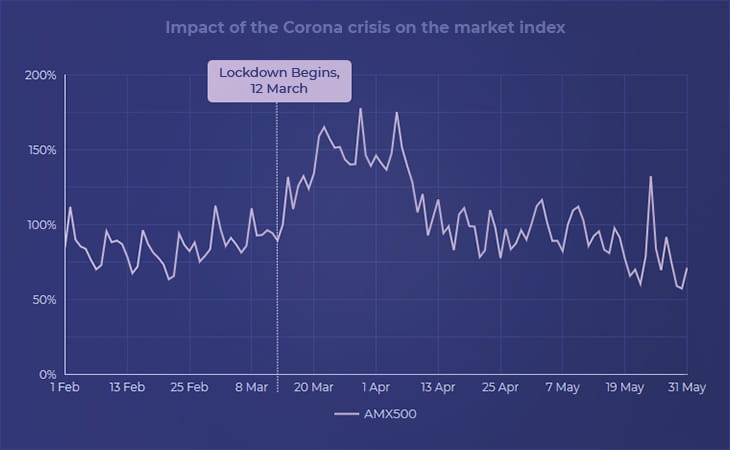
  • How have advertising sales developed on average since the coronavirus pandemic?
  • Is it only my business experiencing weaker sales on weekdays than on weekends?
  • Can the weather have an influence on the ACOS?

Access is free and exclusive via an invitation link.

Request free access